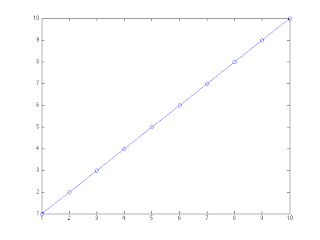
x=1:10;
plot(x,'o-');

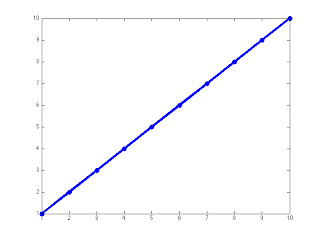
You can thicken a line by finding the elements of the line property. Let's say that you wanted to make the line width 4pt, you would do the following:
ch = get(gca,'children');
ln = ch(strmatch('line',get(ch,'Type')));
set(ln,'Linewidth',4);

As you can see, the line is much thicker. Play around with getting the 'children', as there's a lot of cool stuff that you can do to help you make your graphs prettier. You can basically do everything in 'edit plots' without changing into edit mode. :)
No comments:
Post a Comment